
If you’ve spent a winter in D.C., you know it’s one of the tougher spots in the region for snow accumulation. D.C.'s official measurement site at Reagan National Airport sits near sea level, next to the Potomac River, and within the urban heat island — all factors that tend to keep it a bit warmer than surrounding areas.
As a result, D.C.’s official average snowfall of 13.7 inches — and declining — doesn’t fully capture how much snow falls across the broader region.
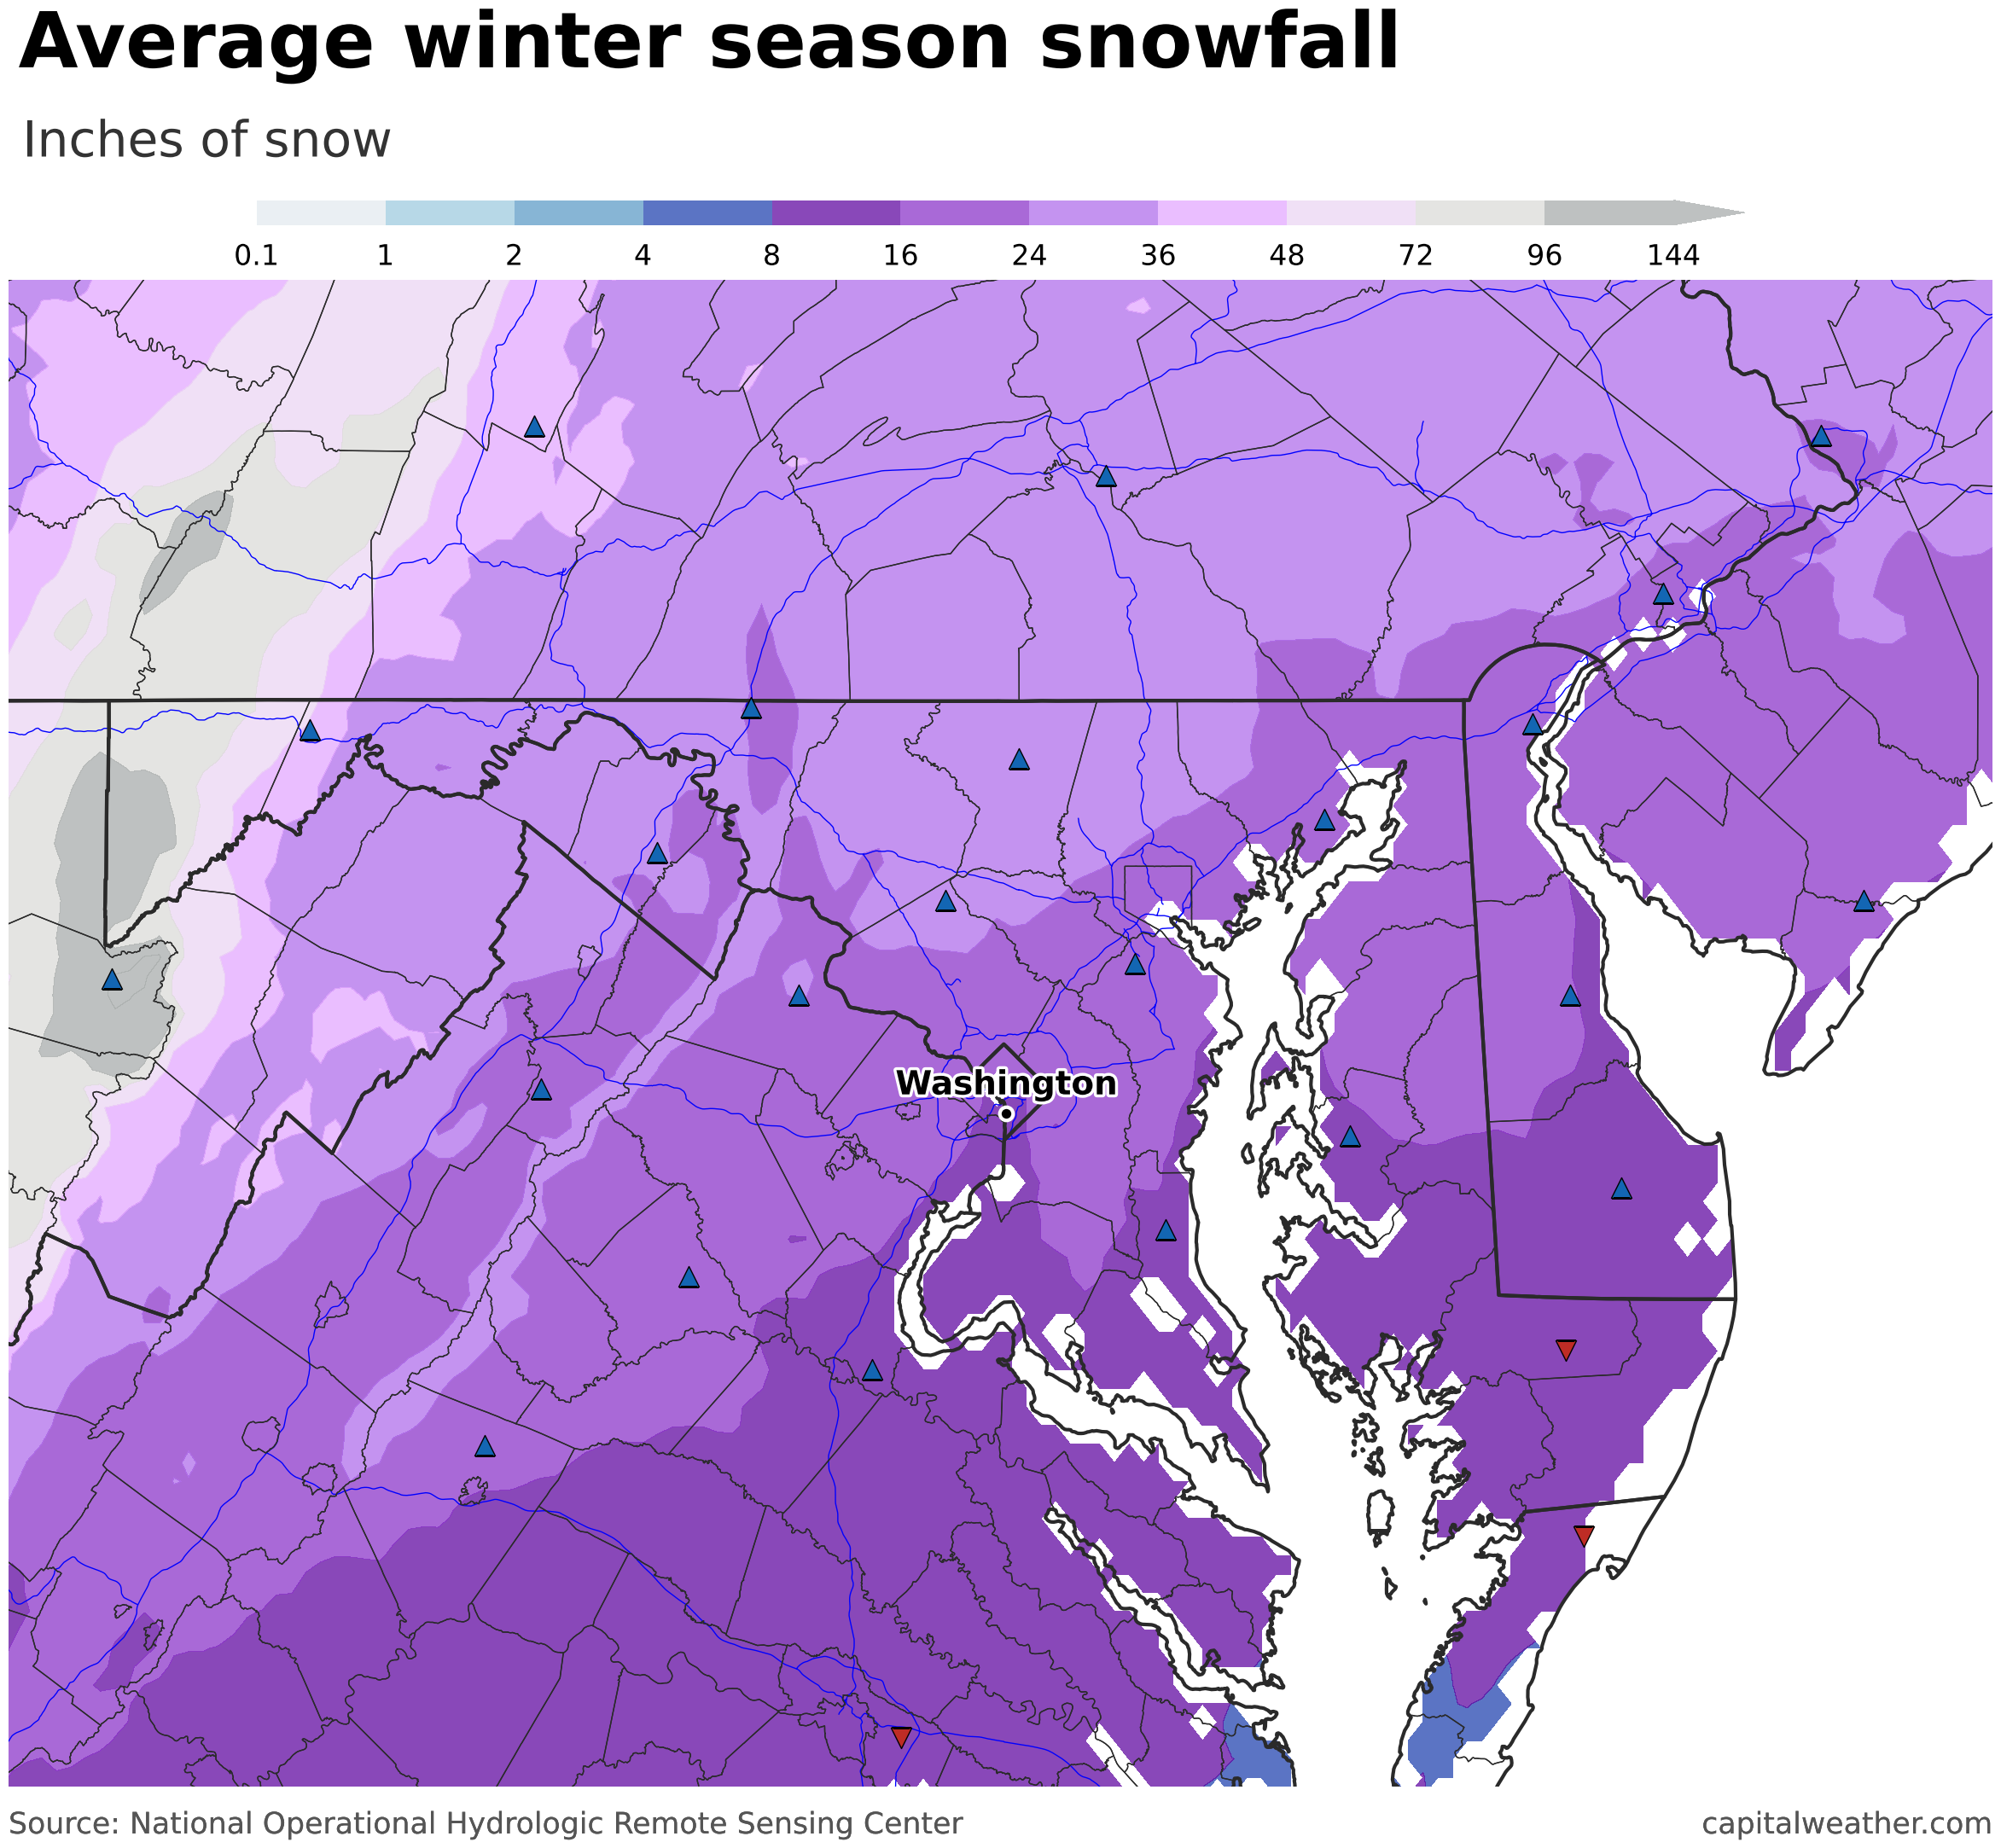
How snowfall varies
D.C.’s 13.7-inch average compares to about 21 inches at Washington Dulles International Airport and 19.3 inches at Baltimore-Washington International Marshall Airport. Much of that difference follows a simple rule: as you move north or west in the region, snowfall tends to increase.
Several factors drive that gradient — higher elevation, greater distance from the Chesapeake Bay and Atlantic Ocean, slightly higher latitude, and less influence from the urban heat island. Development also thins out away from the Interstate 95 corridor, meaning fewer surfaces that retain heat.
While the number of long-term cooperative observers is more limited here than in parts of the Northeast, a few key sites help fill in the picture.
One of the region’s snow leaders is Damascus, Maryland, where the average is 31.4 inches. It sits near 700 feet in elevation along Parr’s Ridge, a band of higher terrain extending through northern Montgomery County into central Maryland. Elevations along the ridge climb to around 1,100 feet farther north.
Elsewhere in Maryland, snowfall averages include about 15.9 inches near Upper Marlboro, 15.8 inches in Beltsville, and 15.1 inches in Mechanicsville.
In Virginia, Vienna averages 18.5 inches and The Plains about 19.8 inches.
Nearly all of these locations receive more snow than D.C.’s official total — even some to the south. For many areas west of the Fall Line, where elevation rises quickly from the coastal plain into the Piedmont, seasonal snowfall can exceed D.C.'s official tally by several inches.
Farther north and west, totals climb more substantially. Parts of northern Maryland average close to 30 inches, while areas near and west of I-81 — including around Winchester — approach two feet per year. Immediately east of the Chesapeake Bay, snowfall drops off again, generally ranging from about 14 to 16.5 inches.
And beyond the immediate region, winter looks entirely different. In the mountains of western Maryland and West Virginia, where elevations rise above 3,000 to 4,000 feet, annual snowfall can reach 10 to 15 feet — a different climate altogether despite the relatively short distance.
For a broader look at how snowfall varies across the East Coast, explore the interactive map above.
Where snow is measured
Snowfall in the D.C. region is tracked at several key National Weather Service sites. The primary ones nearby are three airports, National, Dulles and BWI. BWI serves as Baltimore’s official site, even though it’s well outside the city center.
Why airports? Simply put, they offer reliable, around-the-clock staffing. Accurate, real-time weather observations are essential for aviation, making airports among the most consistent places to measure snowfall.
Beyond airports, another important source is the network of cooperative observers. These trained volunteers use standardized equipment and serve as trusted partners with the National Weather Service, often providing long-term records.
Additional observations come from networks like CoCoRaHS and reports from the public. While these can be valuable — especially during storms — they typically lack the consistency and length of record needed for climate averages.
Our data tools are imperfect
The top map above is based on “gridded” National Weather Service data, which blends high-resolution snowfall modeling with real-world observations. The result is a solid, representative picture of how snow varies across the region — though not a perfect one.
It also covers a relatively short period — currently 18 seasons (soon to be 19), beginning in 2008-2009. Standard climate averages typically span 30 years, so this is a more limited sample.
The point map above adds more detail from specific observation sites, though coverage across the D.C. area remains somewhat limited.


