D.C.’s weather history includes an impressive range of extremes — a 121-degree spread between the hottest and coldest temperatures ever recorded.
These charts show how daily temperature records are distributed through the calendar year. In recent decades, the record book has been tilting increasingly toward warmth, but the region’s climate has produced remarkable swings in both directions.
Record daily temperatures
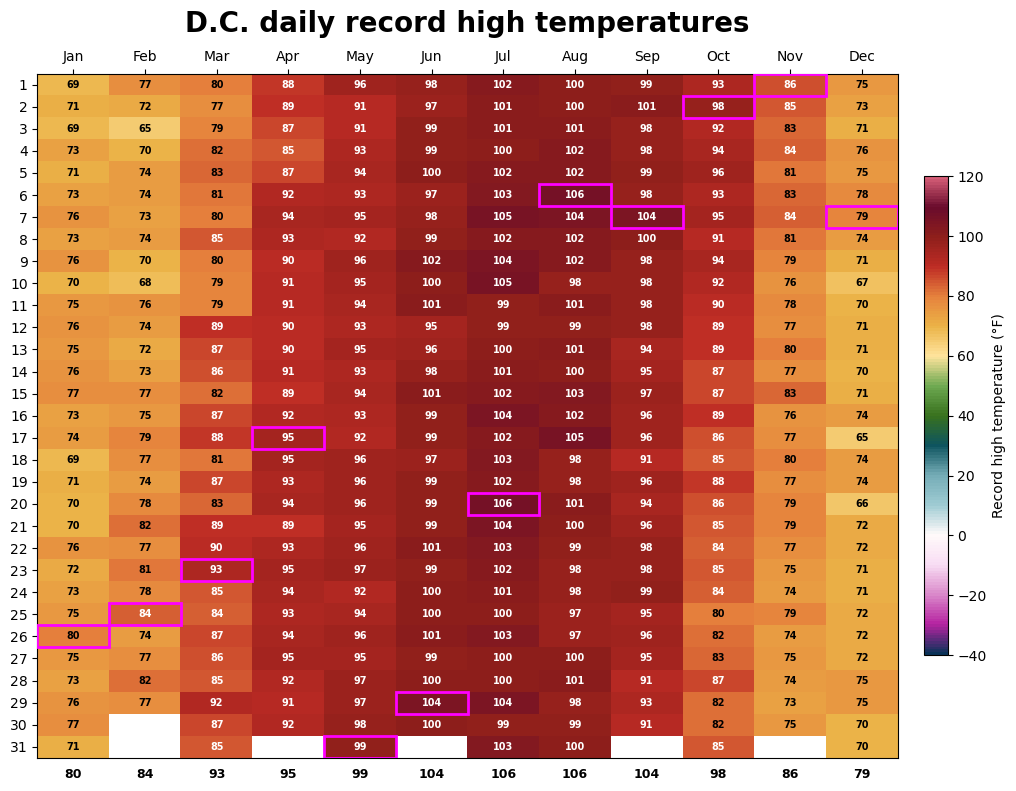
Record highs of 90 degrees or higher appear from mid-April through early October, reflecting the long reach of D.C.’s warm season. Record lows of 15 degrees or colder cluster between late November and early March, when blasts of Arctic air surge into the region.
The city’s hottest temperature on record is 106 degrees, reached twice — on Aug. 6, 1918, and July 20, 1930. D.C. has also hit 105 degrees three times, most recently during the intense heat wave of July 7, 2012.
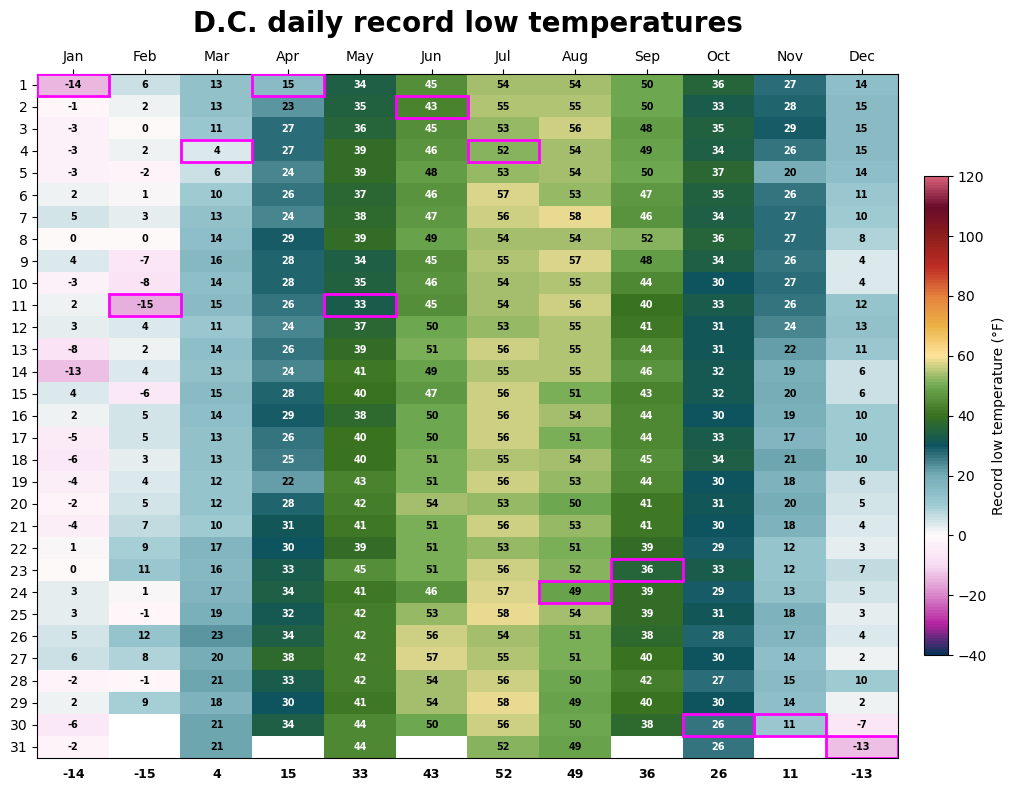
At the other extreme, the coldest temperature ever recorded in Washington is minus-15 degrees, set Feb. 11, 1899, during one of the most severe cold waves in U.S. history. Subzero readings have become rare in modern times: the last occurred Jan. 19, 1994, when the temperature fell to minus-4 degrees.
The number of record highs and lows set by decade
Most of D.C.’s record low temperatures were set early in the climate record, which dates to 1872. Since observations moved to Reagan National Airport in the mid-1940s, breaking those cold records has become increasingly difficult.
Meanwhile, record highs — along with record warm overnight lows — have continued to occur regularly, a signal of the region’s warming climate. In many years, several new warm records are set.
In 2024 alone, D.C. recorded 11 daily record highs, including three that exceeded 100 degrees. By contrast, the most recent record low occurred nearly a decade earlier — Feb. 20, 2015, when the temperature dropped to 5 degrees.
D.C. record high chart
D.C. record low chart