
Drought is a prolonged stretch of abnormally dry conditions that can strain agriculture and water supplies. While it’s often associated with the arid western United States, it’s a regular part of the climate in and around D.C., despite the city averaging more than 40 inches of precipitation annually.
Since 2000, the federal U.S. Drought Monitor has identified more than a dozen drought episodes affecting the region, along with additional periods of near-drought conditions classified as “abnormally dry.”
Most recently, much of the period from mid-2024 through at least spring 2026 has featured some level of drought in the D.C. area. From 2023 through 2025, annual precipitation ran roughly 5 to 7 inches below normal. Even so, past droughts have brought even larger deficits.
The D.C. area's worst drought
The year that helped usher in the Dust Bowl, 1930 stands as the benchmark drought for the D.C. area.
Dry conditions were widespread across the central and eastern United States and persisted into 1931. On average, about half the region fell into extreme or exceptional drought — the two highest categories. At the peak, from August 1930 through April 1931, essentially the entire area was gripped by the most severe level of drought.
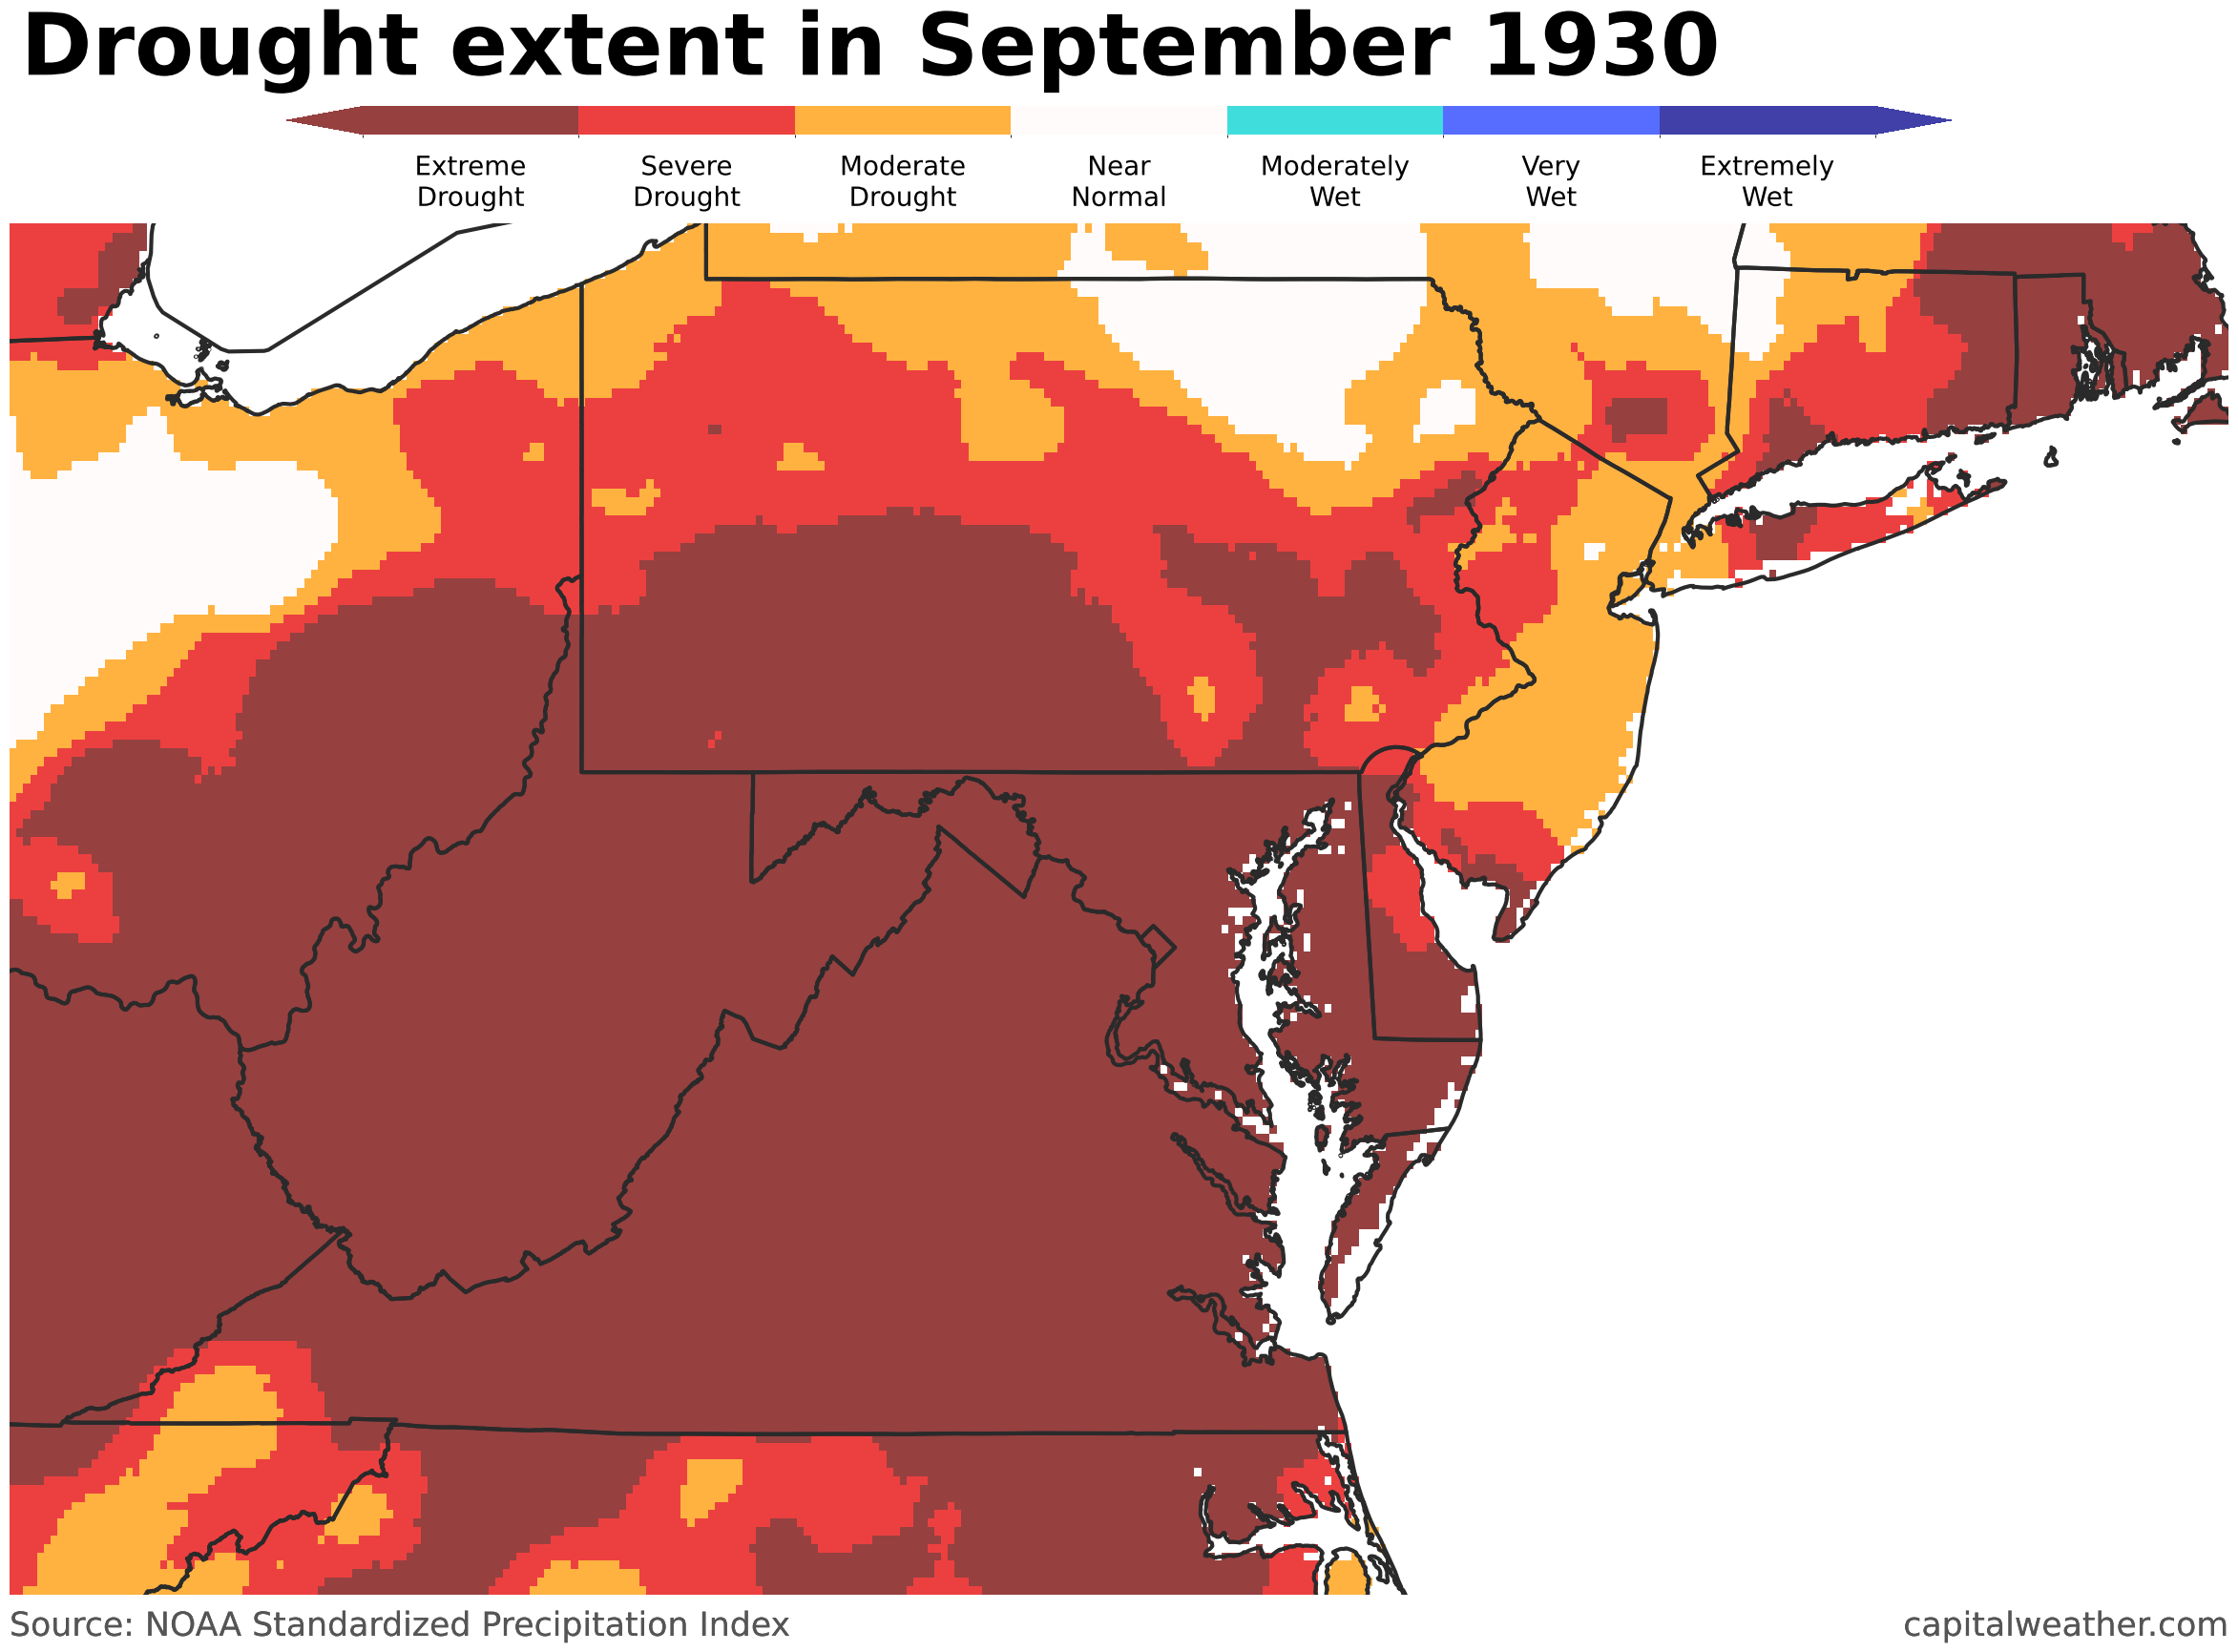
The numbers tell the story. From July 1930 through June 1931, only 23.04 inches of precipitation fell — the lowest 12-month total on record and about 17 inches below normal at the time. The calendar year 1930 alone brought just 21.66 inches, also the lowest in modern records and roughly 19 inches below average.
The impacts were devastating. At least 30 D.C. residents died amid the intense heat and dryness, and crop losses in the surrounding region totaled around $40 million.
That summer’s heat was extreme and amplified by the parched conditions. Temperatures reached 100 degrees or higher a record 11 times in D.C., including a peak of 106 degrees on July 20 — tied for the highest on record. Some localized readings approached 110 degrees.
Waterways suffered as well. Rivers across the region ran dangerously low.
As LoudounHistory.org described it, the Potomac, Rappahannock and Rapidan were “reduced … to a series of fetid puddles,” fouled by dead fish, algae and animal waste.
Wildfires were also widespread. At least 300,000 acres burned in Virginia, further degrading already poor air quality.
Other high-end droughts
Beyond 1930 and 1931, several other notable droughts have occurred with some frequency in the D.C. area.
These years don’t match the severity of the Dust Bowl era but were still significant. Below are some of the most intense episodes, ranked by severity and focused on the two highest drought categories:
2002. The drought began to take shape in late 2001, as precipitation ran persistently below normal and groundwater levels declined sharply. By late January 2002, drought warnings were in place across parts of the region.
Extreme drought, the second-highest category, affected D.C. from February to April and again from July through August. One of the hottest summers on record at the time intensified conditions, contributing to low flows on the Potomac River and prompting releases from upstream reservoirs. It marked only the second time such releases had been needed, following a similar response during the 1999 drought, after the system was built in the wake of the 1960s drought.
1981. Dry conditions were already entrenched across much of the central and eastern United States by late 1980, likely set in motion by the exceptionally hot summer and fall that year. The drought expanded along the East Coast, including the D.C. area, through the spring of 1981 and lingered for much of the year.
From July 1980 through June 1981, just 26 inches of precipitation fell in D.C. — the third lowest total on record for that 12-month period. Streamflows dropped to levels comparable to a previous major drought that peaked in 1966.
1966. Often considered the peak of a longer-running drought, 1966 followed several years of drought across the Northeast. From May through August, less than half of normal rainfall was recorded in the D.C. area.
By late summer, the region faced its first water emergency in more than a century. On Sept. 11, flow on the Potomac River at Chain Bridge fell to a record low.
Relief finally arrived later that month with the heaviest rainfall in years, beginning the recovery. The severity of this drought accelerated the development of regional reservoirs designed to maintain water supply during future low-flow periods.
Related reading: Washingtonian magazine on the drought of 1966
2007. This marks the most recent time D.C. entered extreme drought, which peaked in October. The region sat on the northern edge of a widespread Southeast U.S. drought that peaked in 2007 after developing the year prior.
That fall featured a 34-day stretch without measurable precipitation, ending Oct. 18 — a record at the time until a 38-day dry streak in fall 2024 surpassed it.
Heavier rainfall late in October eased conditions back to “abnormally dry,” but lingering drought impacts persisted into 2008.
Longest droughts
The longest stretches of abnormal dryness and drought in the D.C. area have persisted for three years or more.
Notable examples include February 1925 to May 1928 (40 months), February 1909 to January 1912 (36 months), June 1913 to May 1916 (36 months), and May 1964 to April 1967 (36 months).
The longest such stretch in recent history ran from November 2000 to November 2002, lasting 25 months.
Despite its severity, the Dust Bowl-era drought of 1930 lasted “only” 21 months, from November 1929 to July 1931.
However, when focusing specifically on extreme to exceptional drought — the two highest categories — 1930 ranks as the most prolonged event. Conditions remained at that level for 12 months, from July 1930 through June 1931.
How drought is assessed
One of the primary tools used today to assess drought — the U.S. Drought Monitor — only dates back to 2000. For longer-term historical analysis, other indices are used, including the Palmer Drought Severity Index (PDSI) and the Standardized Precipitation Index (SPI).
For this analysis, we primarily relied on the SPI to examine drought conditions in earlier periods.
According to the University Corporation for Atmospheric Research, "the SPI has been recognized as the standard index that should be available worldwide for quantifying and reporting meteorological drought."
For both the SPI and U.S. Drought Monitor, drought is rated on a 0 to 4 scale:
- D0: Abnormally dry
- D1: Moderate drought
- D2: Severe drought
- D3: Extreme drought
- D4: Exceptional drought
In the chart above and across the analysis, the statistics examine not just D.C. but the counties surrounding it.
When droughts happen
Using the SPI scale, the D.C. area averages about five drought episodes per decade, most of which are relatively short-lived.
The 1960s stand out as the most active decade, with 12 separate droughts — notable given that it was also a period of above-average snowfall in the region.
On a monthly basis, there isn’t a strong seasonal signal. Looking at the two most severe categories, April ranks as the most common month for drought, narrowly edging out October. July and September also rank relatively high, but overall there’s less of a summer and fall skew than might be expected.
The least likely months for severe drought are January and December, though the difference is modest. Many of the most significant droughts have spanned the colder months as well.


