
D.C. is a true four-season city. Summers tend to be hotter than winters are cold, while spring and fall often deliver some of the year’s best weather.
Temperatures are trending upward as the climate warms — a shift that stands out clearly when looking at the list of hottest years since records began in 1872.
Precipitation is fairly evenly distributed through the year, although winter — when some of it falls as snow — is a bit drier than the other seasons. And perhaps surprisingly, D.C. is actually a wetter city than Seattle.
Annual temperature
Annual average temperature is calculated by averaging each month’s temperature — itself based on the average of daily highs and lows. Because months have different lengths, each contributes equally to the yearly average, rather than weighting all 365 days the same. As a result, a straight average of all daily temperatures would yield a slightly different number.
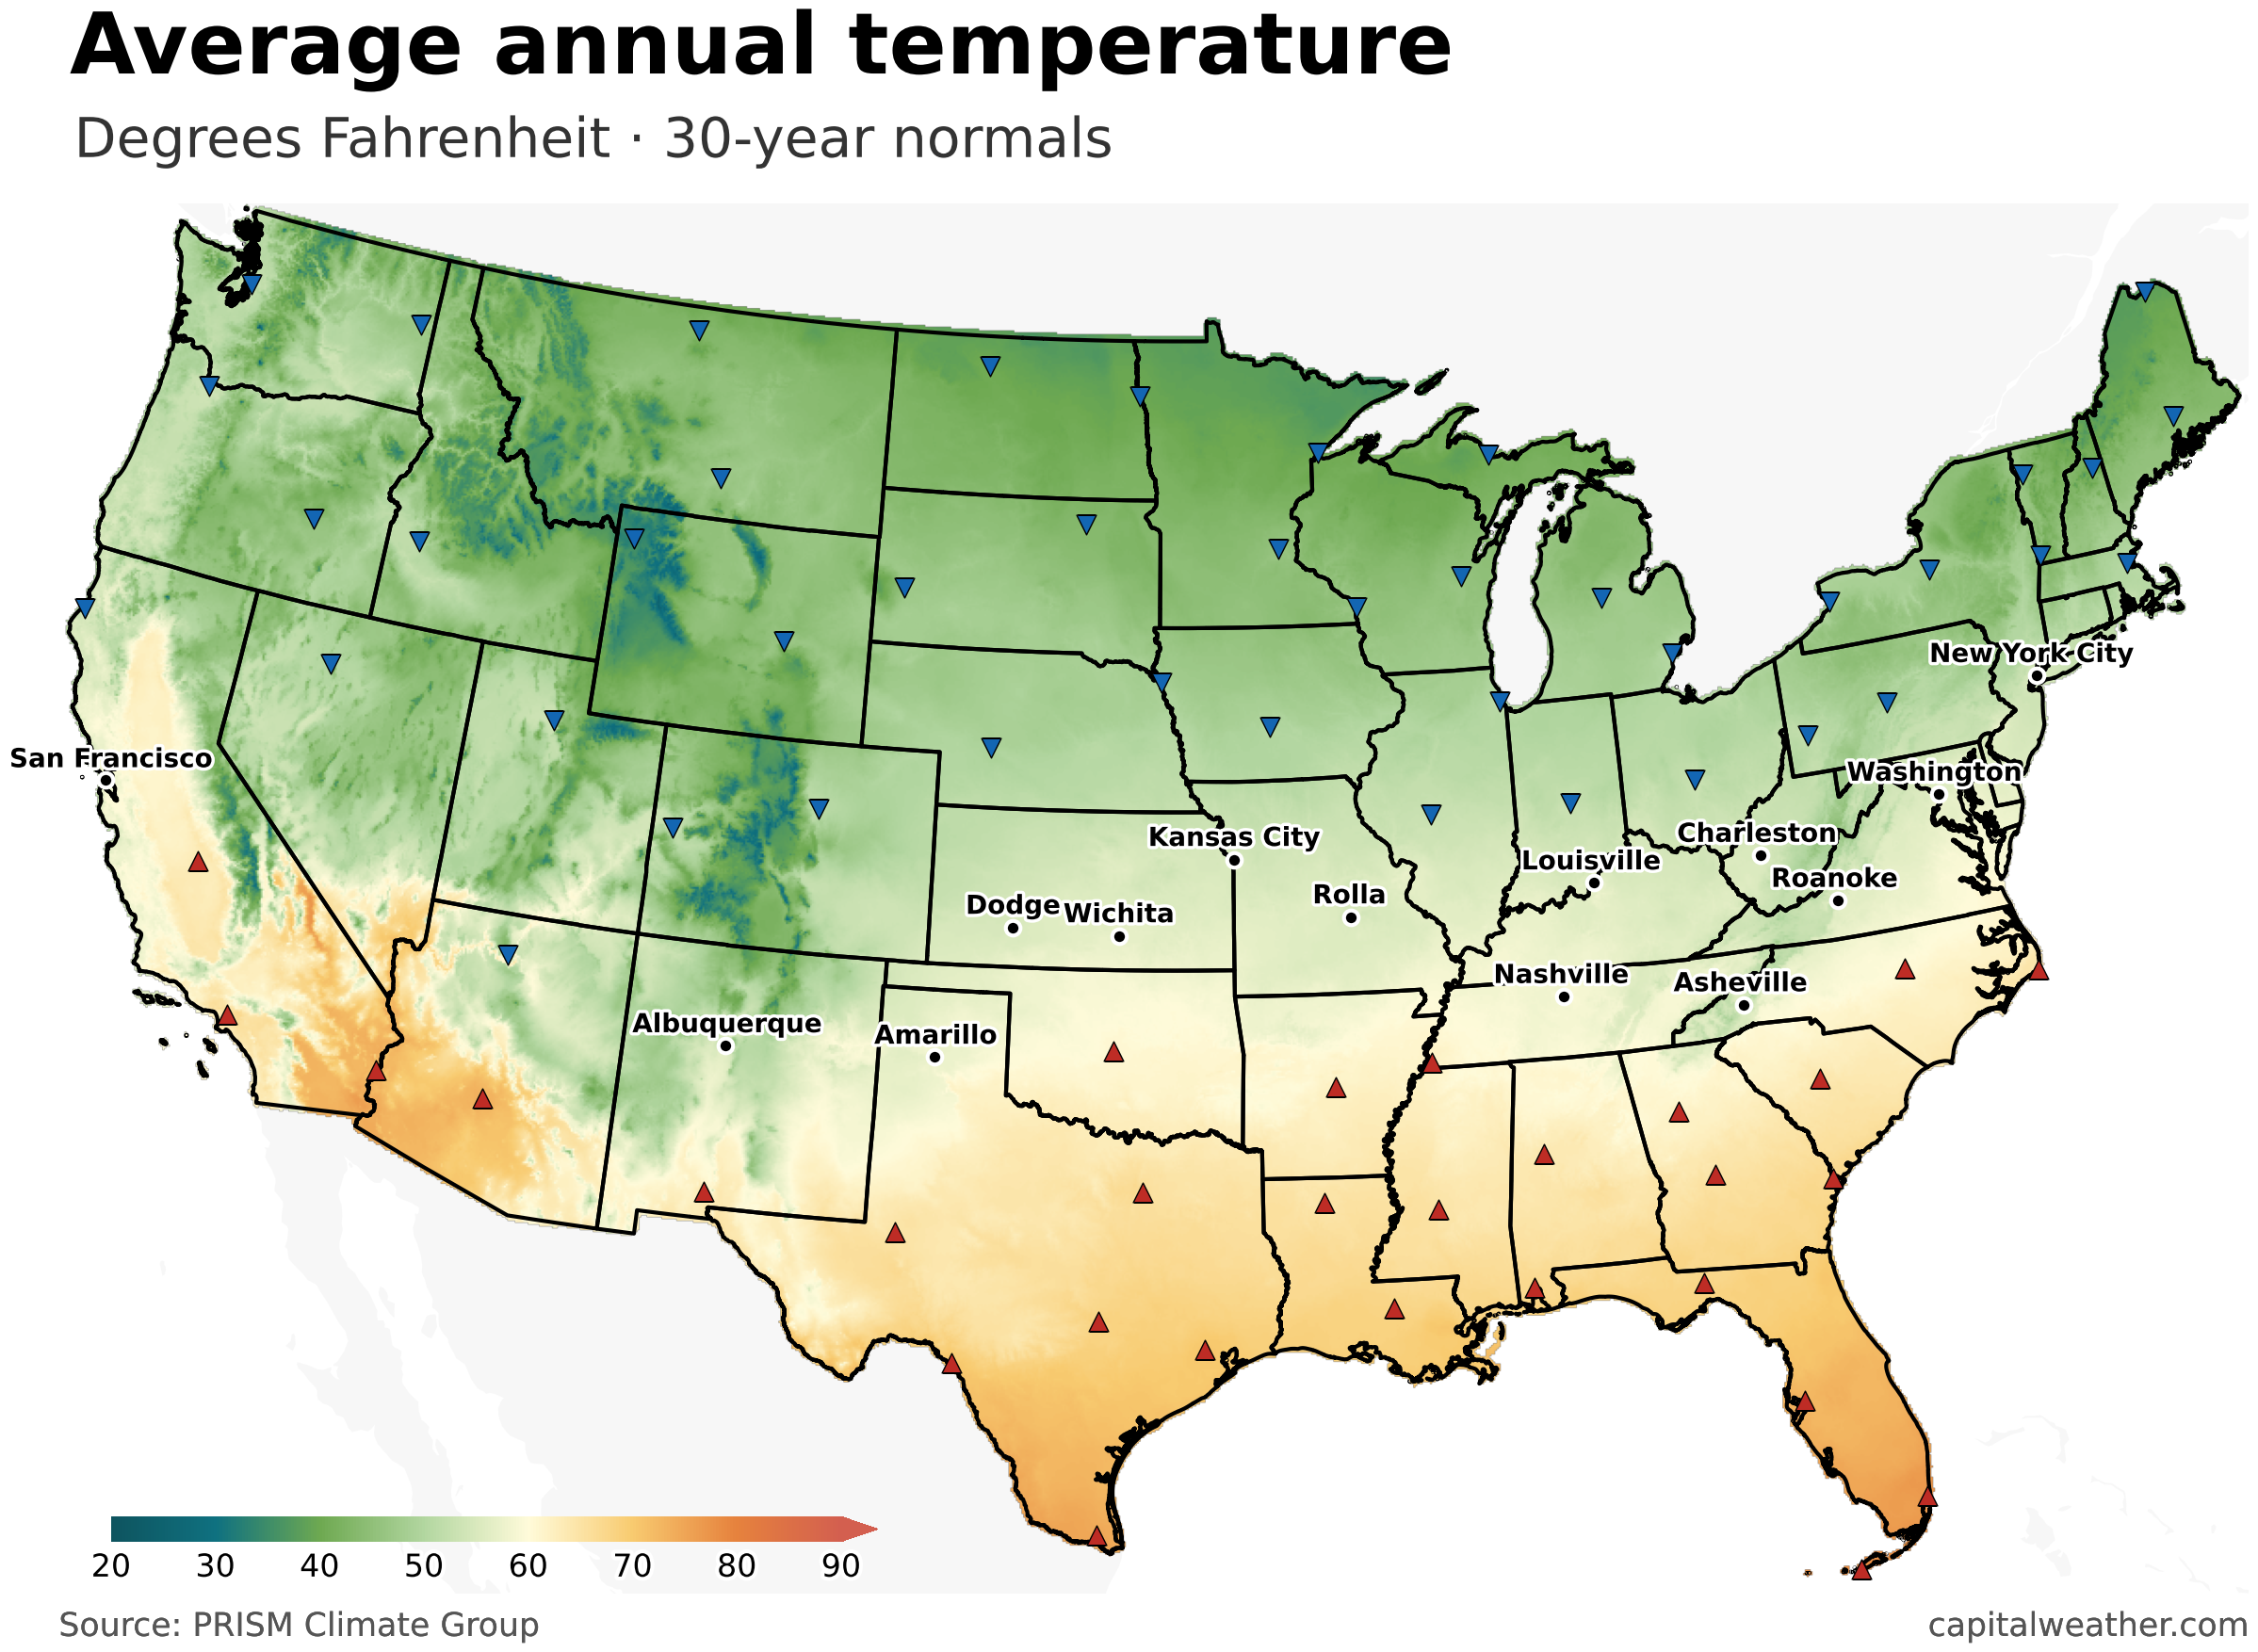
In D.C., the annual average temperature is 59.3 degrees, based on 1991–2020 climate normals from the National Oceanic and Atmospheric Administration.
The warmest year on record is 2024, with an average temperature of 61.8 degrees, edging out 2012 at 61.5 degrees.
Nine of the 10 warmest years on record have occurred since 2012 — a clustering that would be extremely unlikely without the influence of human-caused climate change and urbanization.
The annual average temperature has risen by about 5 degrees since the early 1900s.
Washington’s coldest year on record was 1904, with an average temperature of 52.2 degrees. Most of the coldest years occurred long ago, before official observations moved to National Airport in 1945. Since then, the coolest year has been 1958, when the average temperature was 55.5 degrees.
Cities with annual average temperatures similar to D.C.’s include San Francisco, Albuquerque, Nashville, and Roanoke.
Annual precipitation
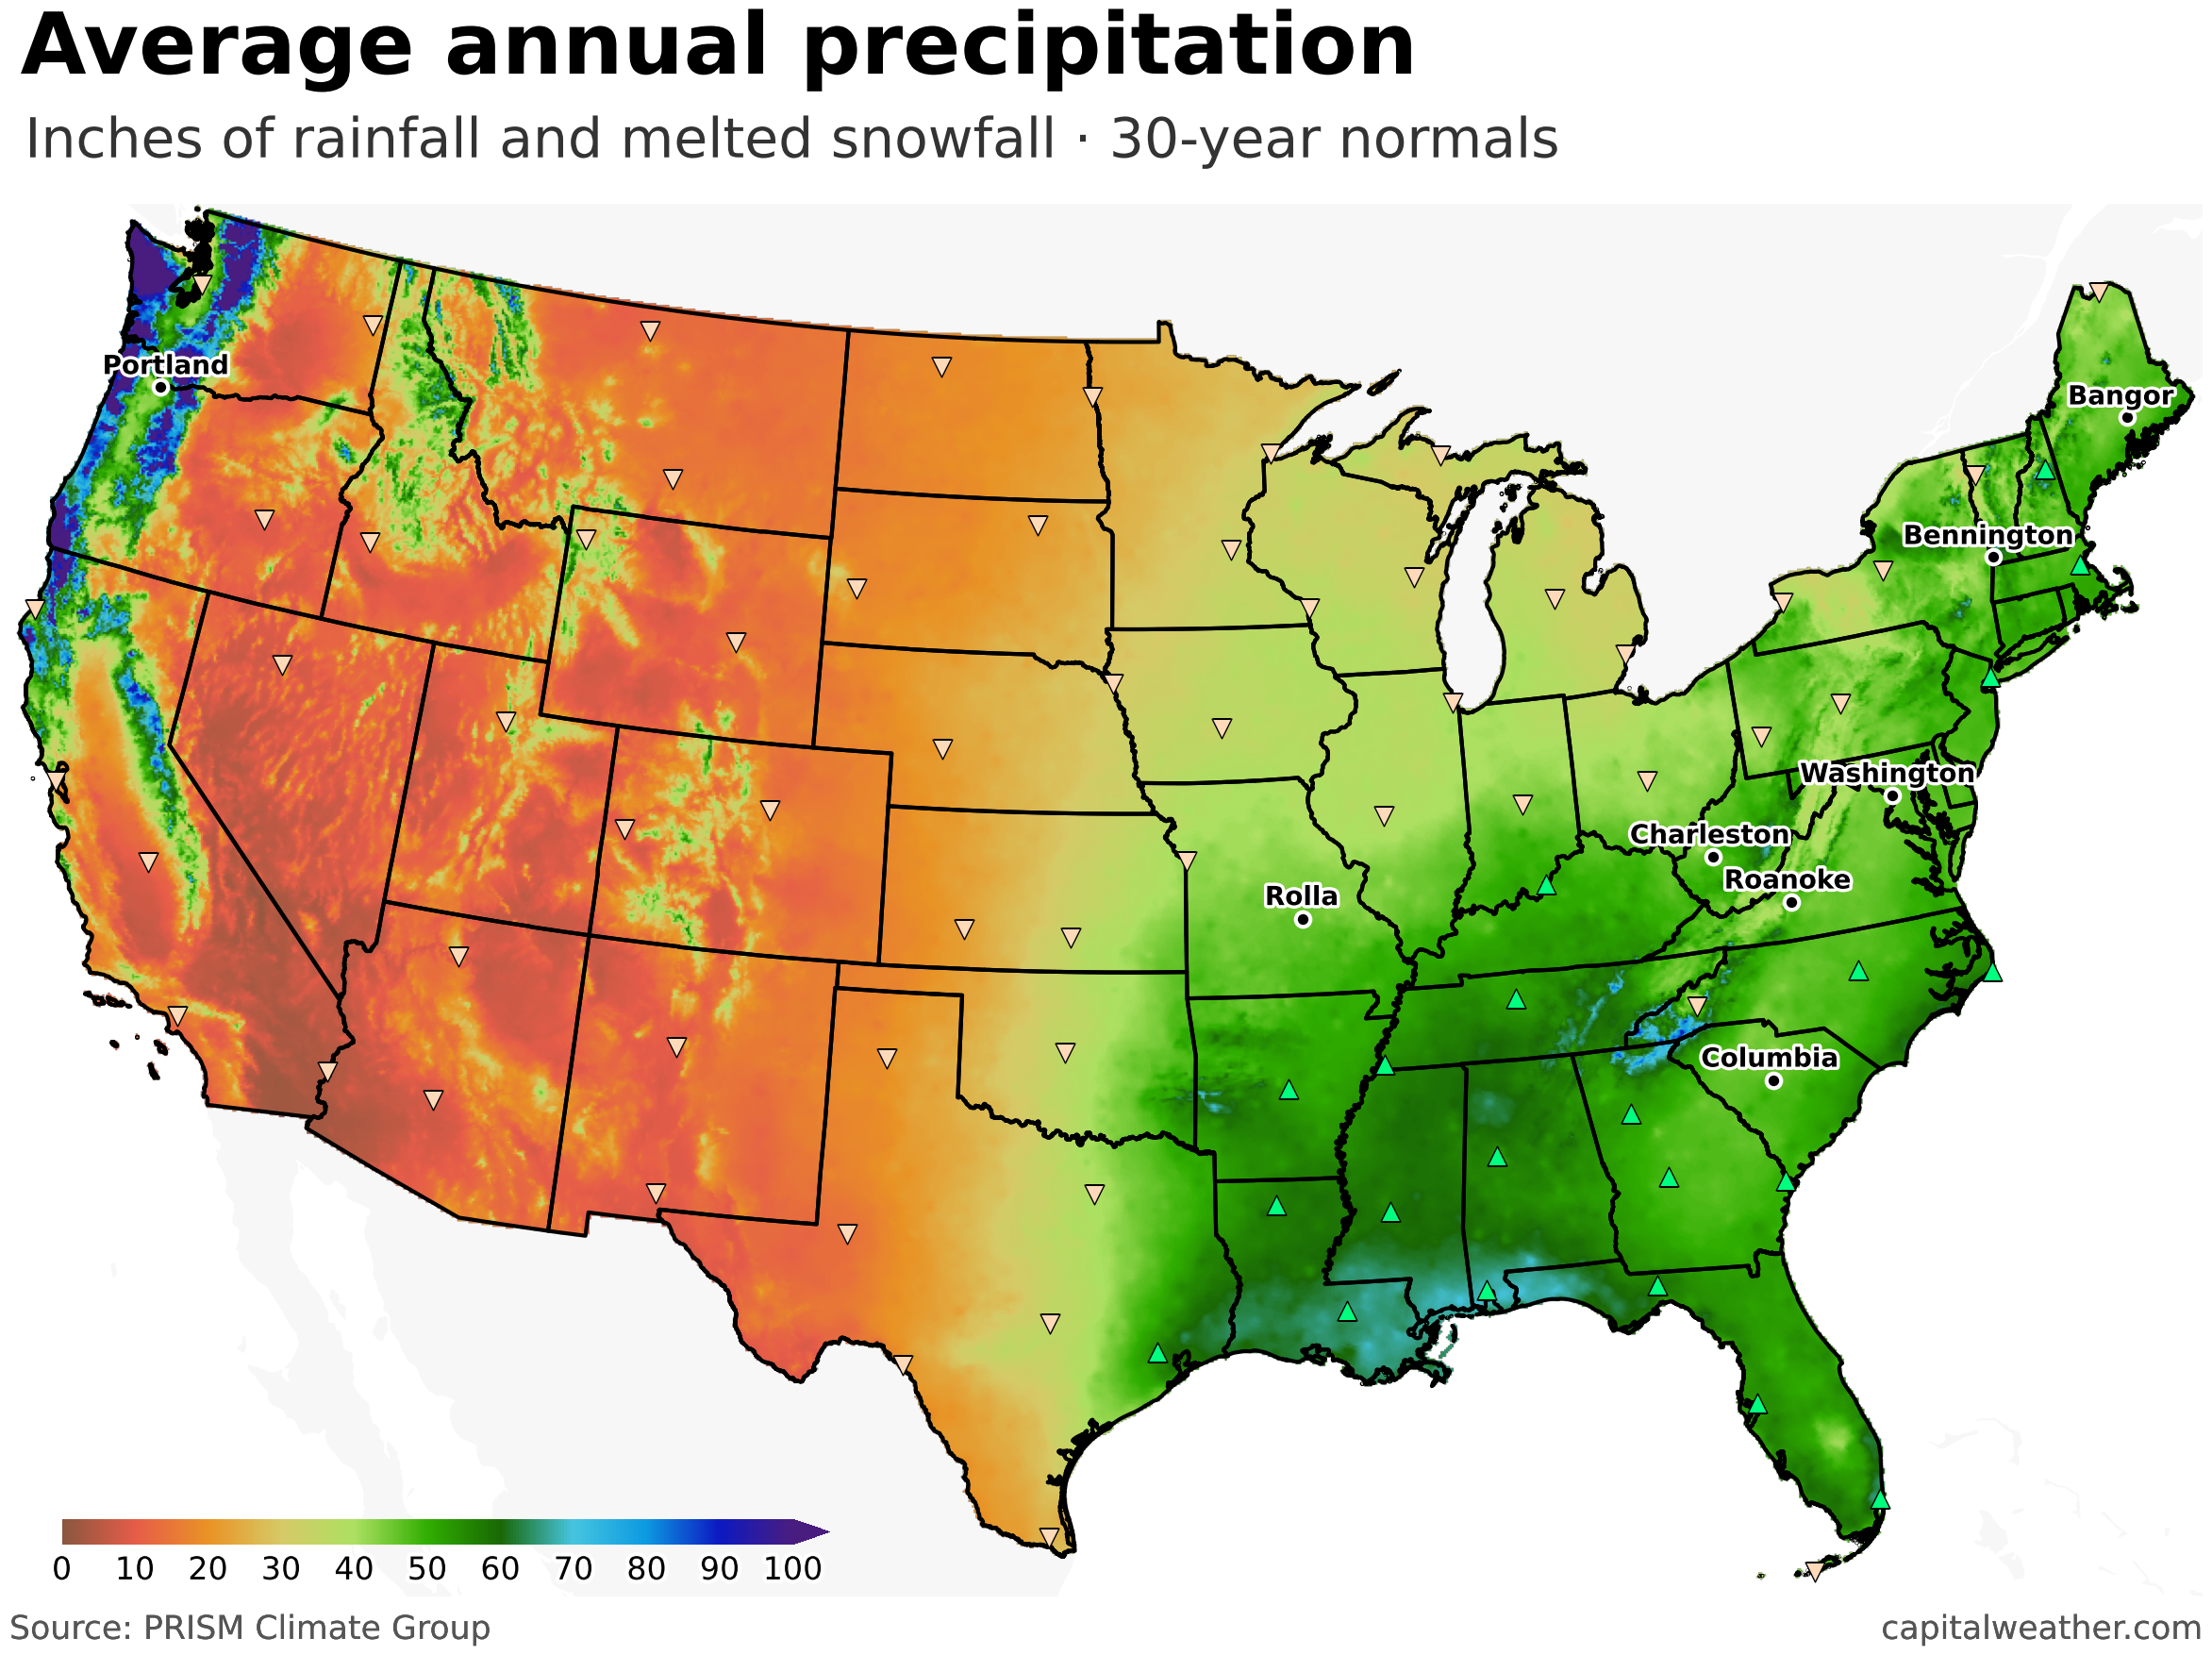
D.C. averages 41.82 inches of precipitation per year, based on 1991–2020 climate normals. Rainfall is fairly evenly distributed, with July the wettest month and January the driest — reflecting the greater moisture available during the region’s humid summers compared with winter.
The wettest year on record was 2018, when an astounding 66.28 inches fell. Much of the surrounding region was also exceptionally wet. Dulles Airport recorded 66.74 inches, and Baltimore logged 71.82 inches — both their wettest years on record.
At the other extreme, just 21.66 inches fell in 1930 during a prolonged drought that coincided with the Dust Bowl era. At National Airport, the driest year on record is 1965, with 26.94 inches.
While annual precipitation has remained relatively steady over time, it has fluctuated between about 38 and 44 inches based on a running 30-year average.
Much of the Lower 48 averages less precipitation than D.C. Cities with similar annual totals include Portland, Oregon; Columbia, South Carolina; and Bennington, Vermont.


